GSC crawl stats downloader
by Valentin Pletzer - April 10th, 20202
The goal of this article is to explain the idea behind the gscDownloader extension and some of the usecases I had in mind when building it.
Google Search Console is a great toolkit for anyone who seeks to optimize their website. The search results performance report is probably the most visited page within it but there is a lot to learn in all the other reports especially the crawl stats report which is somewhat hidden in the settings section.
Why build an extension for crawl stats export?
Nearly everything that can be found in the Search Console can be exported to Google Sheets, Excel or a CSV file but only a few selected datasets can be accessed via API as well. While I find crawl stats immensely useful the data can not be exported via an API and the data itself is only kept for 90 days. And even worse: crawl stats is split into 42 sub-reports and the data can only be saved as 42 individual reports. This Chrome extension aims to help with this tedious task by reducing this to a single click rather than 42 individual ones.
How to start using it
In order to make use of the Chrome extension you have to get it from the official Chrome Web Store and install it. Now you will find a downward pointing arrow icon right next to your Chrome address/search bar (or hidden in the puzzle piece dropdown).
If you click the icon you will open the main page of the extension and the next step is to connect to the Google Search Console property of which you want to download the crawl stats data from. This is done by simply opening the Google Search Console in another tab of the same Chrome browser you installed the extension to. (You can open it before or after opening the extension page, it shouldn’t matter.)
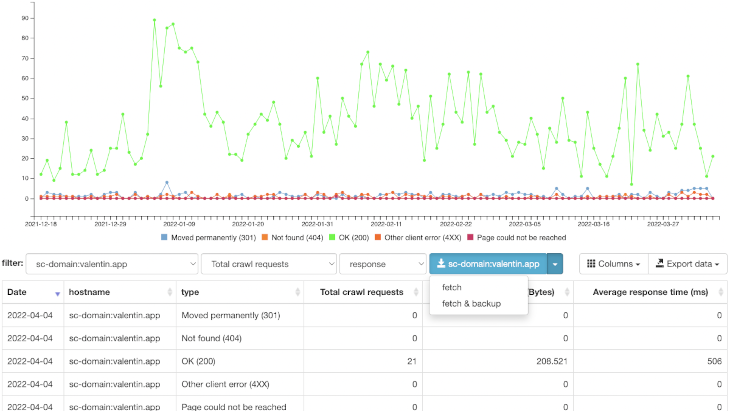
Once you have opened the property of which you want to download the crawl stats data from, you should see the name of that property on the blue button changed to that GSC property (e.g. in the screenshot above it’s “sc-domain:valentin.app”). You might even drill down a bit more and not only select a domain property but a single hostname within the domain property. Now select fetch to simply download and process the data or select “fetch & backup”, which will not only download the data but also save the original CSV files in a sub-folder named “gscData” in your Chrome default download folder.
What to do with the data
My primary goal is to have an easy way to save more than 90 days worth of data and at the same time make it easily analyzable. The graph and the table are synced to show the same data which can be filtered by three different filters right now.
First filter is the property/hostname filter which is used to select the dataset you want to work on. Second filter lets you select the metric which defines which metric you want to see in the graph which can be either requests, size in bytes or average response time just like in Google search console. The main difference is the third filter which allows you to select a category which can be either response, file type, purpose or googlebot type. Select this and you will see all graphs at the same time in the selected category. e.g. in the category “purpose” you will see “refresh” crawl stats and “discovery” crawl stats in the same graph.
Feedback wanted
If you decide to make use of the GSC crawl stats downloader chrome extension I would love to hear from you. While 1.0 may be functional there are already some UX bugs and feature requests I received via Mastodon @VorticonCmdr and a first bug-fixing release is already on the way.
more stuff